LLM agents alternate GPU-bound inference with CPU-bound tool calls over many turns, so
GPU-only energy numbers tell part of the story. We measure GPU, CPU, DRAM and whole-system power together
on a dual RTX PRO 6000 Blackwell server, across agentic coding, mathematical reasoning and continuous serving.
41–45%
of system energy is missed by GPU-only telemetry
63×
more energy per output token: sequential agent vs. saturated serving
<1%
per-token energy change from thinking, which adds 21–75% more tokens
3.2×
better energy efficiency from continuous batching, 1 to 16 req/s
Share of system energy by component
GPU telemetry sees only the GPU segment
GPU
CPU
DRAM
Others
Outside GPU
Agentic codingSWE-bench Verified · 1,406 W
55.9%23.7%19.5%
44.1%
Mathematical reasoningAIME, thinking on · 29,802 mJ/tok
58.8%23.5%16.7%
41.2%
Continuous servingShareGPT, 16 req/s · 1,375 W
58.3%24.7%15.9%
41.7%
Agentic coding and serving: average power. Reasoning: energy per output token.
Agentic-coding shares are as reported in the paper; the other two rows divide each component in the
paper’s Tables 1 and 2 by the system total. “Others” is the residual: fans, VRM and PSU conversion losses,
PCIe links, baseboard.
View as table
Workload
Unit
GPU
CPU
DRAM
Others
System
GPU share
Agentic coding, SWE-bench Verified
W
785
333
14
274
1,406
55.9%
Mathematical reasoning, AIME, thinking on
mJ/tok
17,531
7,018
268
4,985
29,802
58.8%
Continuous serving, 16 req/s
W
802
340
13
219
1,375
58.3%
Abstract
LLM agents that iteratively reason, plan, and invoke tools create workload profiles fundamentally
different from single-pass inference, yet how their energy consumption is distributed across hardware components
and workload phases remains poorly understood. Characterizing these workloads therefore requires simultaneous
visibility into both component-level power and phase-level execution. We conduct a full-stack energy profiling
study combining NVML GPU counters, Intel RAPL CPU/DRAM counters, and Intelligent Platform Management Interface
(IPMI) system-level sensors on 2× NVIDIA RTX PRO 6000 Blackwell GPUs, and profile three representative workloads
with Qwen3.8-27B. For mathematical reasoning, we compare thinking-enabled and thinking-disabled modes. Our
measurements reveal that GPU-only telemetry misses 41–45% of system energy across all three workloads, with
non-GPU components accounting for the remainder. In our setup, the sequential agent workload consumes 63× more
system energy per output token than saturated serving, reflecting the absence of batching, context growth across
turns, and tool-induced idle periods. Extended thinking generates 21–75% more tokens per problem, while per-token
energy differs by less than 1% between modes within each dataset, indicating that the resulting increase in
energy is driven by output volume rather than a change in per-token efficiency. Continuous batching improves
system-level energy efficiency by 3.2× from 1 to 16 requests per second, as GPU power plateaus while throughput
continues to increase with batching depth. In agent and reasoning workloads, energy increases mainly because the
model generates more tokens or runs longer as context grows, while system power changes little. For the
memory-bandwidth-bound reasoning workload, throughput remains unchanged under per-GPU power caps of 400–600 W but
drops sharply at 300 W. These findings suggest that context-management techniques such as summarization and
selective retrieval may help reduce energy consumption in agent deployments.
Full-stack measurement
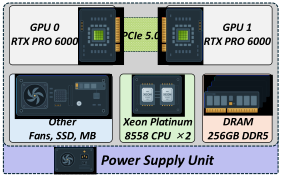
Three interfaces are sampled in one timing loop on a dual-GPU server, so component-level power
lines up with the phases of an agent run.
System power measurement architecture on the dual-GPU server.
NVML 10 Hz
Cumulative per-GPU energy counters.
RAPL 10 Hz
CPU package and DRAM energy counters.
IPMI 1 Hz
CPU, memory, fan and total-system power from BMC sensors.
Pothers = Psystem − PGPU − PCPU − PDRAM
RAPL CPU package power and the IPMI CPU rail differ by only 0.1–0.6%.
Server
2× NVIDIA RTX PRO 6000 Blackwell Server Edition (96 GB GDDR7, up to 600 W each), 2× Intel Xeon
Platinum 8558, 256 GB DDR5.
Model
Qwen3.8-27B served by vLLM 0.19.1, tensor-parallel across both GPUs, BF16, chunked prefill,
131k-token context.
Workloads
Agentic coding. 50 SWE-bench Verified tasks in the official
Docker harness; multi-turn tool calling with extended thinking; one agent, sequential.
Mathematical reasoning. AIME 2022–2024 (90 problems) and
MATH-500, thinking enabled vs. disabled.
Continuous serving. ShareGPT prompts at 1–16 requests per
second under continuous batching.
Metrics
Energy per output token (mJ/tok), energy per task (kJ) and power (W). Energy figures are total
system energy unless marked GPU-only.
Findings
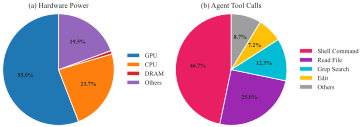
1GPU telemetry alone misses about 44% of system energy
During agentic coding, system power averages 1,406 W. The two GPUs draw 785 W (55.9%),
the CPUs 333 W (23.7%) and DRAM 14 W (1.0%). The remaining 274 W (19.5%) goes to fans, VRM and PSU conversion
losses, PCIe links and the baseboard. Shell commands make up 46.7% of tool calls; they often launch
subprocesses or run tests while the GPU is largely idle and the CPU stays active.
SWE-bench agentic coding: (a) system power decomposition, (b) agent tool-call distribution.
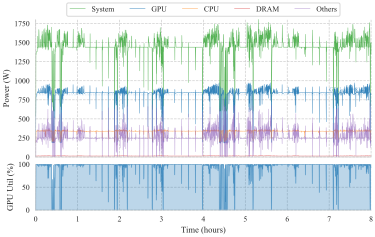
2GPU power bursts and idles; system power stays elevated
GPU power rises to about 800 W during inference and falls to about 150 W during tool
execution, as utilization swings between near 100% and near 0%. System power generally remains elevated
between inference bursts because the CPUs stay active during shell commands and test runs.
Agent power trace over a selected 8 h window of SWE-bench execution. Top: component-level power.
Bottom: GPU utilization.
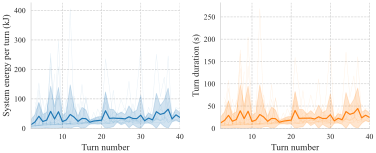
3Per-turn energy tracks turn duration, not power
System energy and duration per turn both tend to rise over the course of a trajectory, while
average system power changes little. Longer execution is the primary source of the increase, consistent with
longer prefill as context accumulates across turns.
Per-turn system energy and duration across SWE-bench tasks. Light lines: individual tasks;
bold: mean ±1σ.
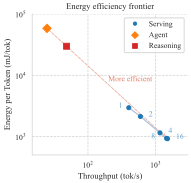
4A sequential agent uses 63× more energy per token than saturated serving
At the system level the agent workload consumes 58,383 mJ per output token, about 63× that of
serving at 16 requests per second. Three characteristics explain the gap: no batching across requests,
prefill work that grows with context, and tool execution between model calls. Under continuous batching,
GPU power largely plateaus by 4 requests per second while throughput climbs from 401 to 1,494 tok/s,
a 3.2× gain in system energy efficiency.
Energy efficiency frontier across workloads (log-log scale).
System energy per output token
mJ/tok
Agent, SWE-bench
58,383
Reasoning, AIME, thinking on
29,802
Serving, 1 req/s
2,955
Serving, 4 req/s
1,147
Serving, 16 req/s
920
Per task: about 2,989 kJ for one SWE-bench task, 313.2 kJ for a thinking-enabled AIME
problem and 53.6 kJ for a MATH-500 problem.
5Thinking costs tokens, not per-token efficiency
Thinking-enabled runs generate 75% more tokens per problem on AIME and 21% more on MATH-500,
with matching increases in energy per problem. Per-token energy differs by less than 0.4% between modes,
so the added energy reflects output volume rather than a change in efficiency.
Dataset
Thinking
Tokens / problem
System mJ/tok
Energy / problem
AIME
enabled
10,506
29,802
313.2 kJ
AIME
disabled
5,991
29,751
178.2 kJ
MATH-500
enabled
1,800
29,759
53.6 kJ
MATH-500
disabled
1,488
29,682
44.2 kJ
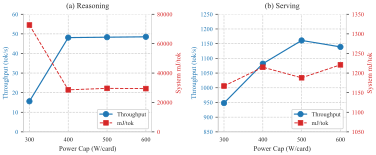
6Capping reasoning: no loss at 400 W, a cliff at 300 W
Reasoning draws about 420 W per card, so 500 W and 600 W caps never bind, and a 400 W cap
trims GPU power without affecting throughput (about 48 tok/s), consistent with memory-bandwidth-bound
decoding. At 300 W, throughput falls by 3.1× and system energy per token rises to 2.5× its value at 400 W.
Serving at 4 requests per second behaves differently: 300 W gives the lowest energy per token
(1,167 vs. 1,215 mJ/tok at 400 W).
Power cap sweep. (a) Reasoning, single request. (b) Serving, 4 requests per second. Throughput on
the left axis, system energy per token on the right.
What this suggests
Account for the full system
GPU telemetry captures 55–59% of system energy here. Carbon estimates should use full-system
measurements or platform-specific corrections.
Manage context
Per-turn energy follows turn duration as context grows. Context management, such as summarization
and selective retrieval, may help reduce agent energy.
Budget tokens
The energy cost of thinking is its extra output. Early stopping and budget-aware decoding may reduce it,
subject to accuracy trade-offs.
Choose power caps per workload
A 400 W cap costs reasoning no throughput and 300 W is a cliff, while serving at 4 req/s is most
efficient at 300 W.
Scope. One dual-GPU server and one 27B model, so generalization to other platforms and
scales remains uncertain. There are no external PDU measurements for AC validation, and the “Others” category
includes estimated contributions.
@inproceedings{luo2026energy,
  title     = {Where Does the Energy Go? Profiling {LLM} Agent Inference on {Blackwell} {GPUs}},
  author    = {Luo, Qi and Li, Kunlin and Wang, Ziwen and Chen, Yun},
  booktitle = {NeurIPS 2026 Workshop on Resource-Aware Agentic AI},
  year      = {2026},
  eprint    = {2609.29707},
  archivePrefix = {arXiv},
  primaryClass  = {cs.DC}
}